
Heatmap lets you know your customer’s engagement in each area and their interests: shopping mall areas, locations of interest, advertisements, etc.
Heatmaps help you deeply understand your customers’ interests and behaviour. Get rich data about your customers, improve their experience & maximize profit.
With version 10, the system can detect WiFi connection data even for each access point. As a result, you will get statistics on:
In the context menu of a Zone, we added the “Heatmap WiFi” option, allowing you to view a heatmap of the WiFi equipment (Gateway with WiFi and access point) by:
We added the following columns to the list of access points:
Besides, to obtain more details, we added the “Data Management Tool” option to the context menu of the zones and access points.
In the “Data Management Tool” at the domain, gateway, user, zone and access point level, we added a panel that allows filtering and exporting the “Log of User WiFi Connections” to an Excel file.
The access point dashboards have been enriched with the following tiles:
The main graph of the access point dashboards enriched with:
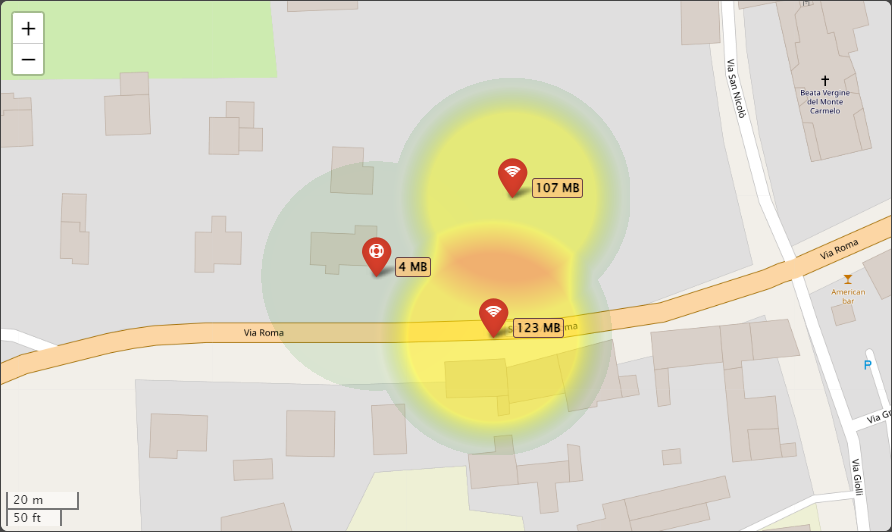
We added the “Locate the User on the WiFi Heatmap” option in the user’s context menu.
You can search and view the heatmap with the gateways and access points where the users made the last WiFi connection and locate them.
This feature is also helpful in finding the staff in a company, doctors or/and patients in a hospital, etc.
The new option “Log of User WiFi Connections” is now available in the user’s context menu.
It shows the details of the connections to the various access points.